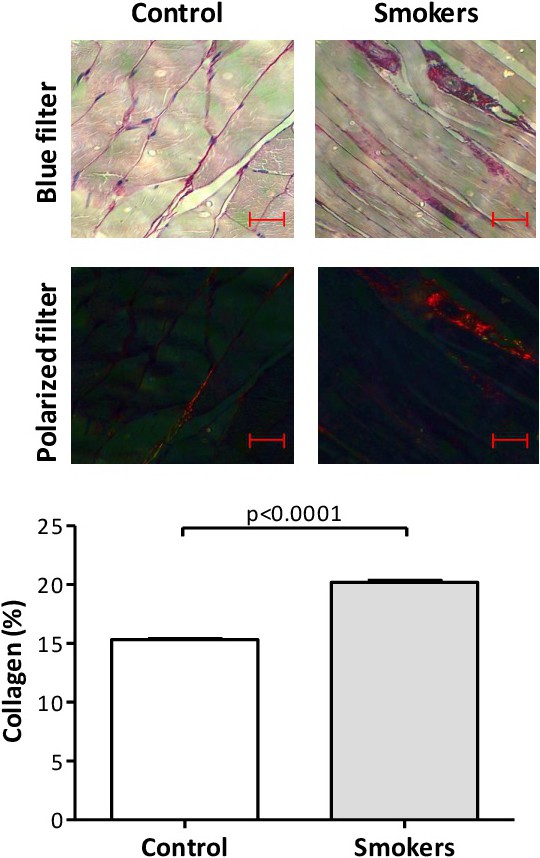
Fig. 2. Cross-sectional images of the diaphragm muscle stained with the Picrosirius technique in both blue filter (standard) and polarized filter (dark red), showing the collagen fibers in both control and smoker group (scale bars = 50 μm). Representative graphic was obtained after stereological analysis. Data are mean ± SEM values.